---
date: 2022-01-27
category: Release
author: Jon Mease
---
# VegaFusion 0.1
**Server-side acceleration for the Vega visualization grammar with Rust and WebAssembly**
By: Jon Mease
---
Today, I'm happy to announce a new open source project I've been working on since stepping down as Plotly's Chief Scientist this past fall. It's called VegaFusion.
VegaFusion provides server-side acceleration for the [Vega](https://vega.github.io/) visualization grammar. While not limited to Python, the initial application of VegaFusion is the acceleration of the [Altair](https://altair-viz.github.io/) Python interface to [Vega-Lite](https://vega.github.io/vega-lite/). Its design was motivated by years of experience working on visualization libraries ([Plotly](https://plotly.com/python/), [HoloViews](https://holoviews.org/), and [Datashader](https://datashader.org/)) and dashboard technologies ([Dash](https://dash.plotly.com/), [Jupyter Widgets](https://ipywidgets.readthedocs.io/en/latest/index.html), and [Panel](https://panel.holoviz.org/)).
## Quickstart: Accelerate Altair in Jupyter
VegaFusion can be used to provide server-side acceleration for Altair visualizations when displayed in Jupyter contexts (Classic notebook, JupyterLab, and Voila). It also eliminates the Altair `MaxRowsError` when generating a chart with over 5000 rows.
First, install the `vegafusion-jupyter` package, along with `vega-datasets` for the example below.
```bash
$ pip install "vegafusion-jupyter[embed]" vega-datasets
```
Then, open a Jupyter notebook (either the classic notebook, or a notebook inside JupyterLab), and run these two lines to import and enable the VegaFusion Altair renderer.
```python
import vegafusion as vf
vf.jupyter.enable()
```
VegaFusion will now be used to accelerate any Altair chart. For example, here's the [interactive average](https://altair-viz.github.io/gallery/selection_layer_bar_month.html) Altair gallery example.
```python
import altair as alt
from vega_datasets import data
source = data.seattle_weather()
brush = alt.selection(type='interval', encodings=['x'])
bars = alt.Chart().mark_bar().encode(
x='month(date):O',
y='mean(precipitation):Q',
opacity=alt.condition(brush, alt.OpacityValue(1), alt.OpacityValue(0.7)),
).add_selection(
brush
)
line = alt.Chart().mark_rule(color='firebrick').encode(
y='mean(precipitation):Q',
size=alt.SizeValue(3)
).transform_filter(
brush
)
chart = alt.layer(bars, line, data=source)
chart
```
Histogram binning, aggregation, selection filtering, and average calculations will now be evaluated in the Python kernel process with efficient parallelization, rather than in the single-threaded browser context.
You can see that VegaFusion acceleration is working by noticing that the Python [kernel is running](https://experienceleague.adobe.com/docs/experience-platform/data-science-workspace/jupyterlab/overview.html?lang=en#kernel-sessions) as the selection region is created or moved. You can also notice the VegaFusion logo in the dropdown menu button.
## Vega Ecosystem Background
VegaFusion is designed to complement the Vega visualization ecosystem. In particular, the [Vega](https://vega.github.io/), [Vega-Lite](https://vega.github.io/vega-lite/), and [Altair](https://altair-viz.github.io/) projects. If you're not familiar with these projects, it will be helpful to take a few minutes to browse their documentation as background for understanding what VegaFusion adds.
### Transforms and Signals
One powerful feature of the Vega visualization grammar is that it includes a rich collection of data manipulation functions called [transforms](https://vega.github.io/vega/docs/transforms/). Transforms have functionality that is similar to that provided by SQL queries or Pandas DataFrame operations, but they are specifically designed to cover data preprocessing tasks that are useful in constructing data visualizations.
For additional flexibility, Vega also provides the concept of [signals](https://vega.github.io/vega/docs/signals/). These are scalar variables that can be constructed using the [Vega expression language](https://vega.github.io/vega/docs/expressions/), which is a subset of JavaScript. Transforms can accept and produce signals.
There are at least two significant advantages to having data transformations and signals included in a visualization specification.
- First, it makes it possible for a visualization to accept raw data files as input and then perform its own data cleaning and manipulation. This often removes the need to generate temporary intermediary data files.
- Second, it enables higher-level libraries like Vega-Lite to automate the creation of rich interactive visualizations with features like [cross filtering](https://vega.github.io/vega-lite/examples/interactive_layered_crossfilter.html) and [drill down](https://altair-viz.github.io/gallery/select_detail.html).
## Motivation for VegaFusion
Vega makes it possible to create declarative JSON specifications of rich interactive visualizations that are fully self-contained. They can run entirely in a web browser without requiring access to an external database or a Python library like Pandas.
For datasets of a few tens of thousands rows or fewer, this architecture often results in extremely smooth and responsive interactivity. However, this architecture doesn't scale very well to datasets of hundreds of thousands of rows or more. This is the gap VegaFusion aims to fill.
## How VegaFusion Works
VegaFusion has two primary components: The Planner and the Runtime.
### Planner
The Planner starts with an arbitrary Vega specification (typically generated by Vega-Lite, but this is not a requirement). The Planner's job is to partition the specification into two valid Vega specifications, one that will execute in the browser with the Vega JavaScript library, and one that will execute on the server with the VegaFusion Runtime.
VegaFusion does not (yet) provide full coverage of all of Vega's transforms and all of the features of the Vega expression language. The planner uses information about which transforms and expression functions are supported to make decisions about which parts of the original Vega specification can be included in the resulting server specification. The advantage of this approach is that VegaFusion can accept any Vega specification, and as more support is added over time, more of the input specification will be eligible for inclusion in the server specification.
Along with the client and server specifications, the planner also creates a communication plan. The communication plan determines which datasets and signals must be passed from server to client, and from client to server in order for the interactive behavior of the original specification to be preserved.
### Runtime
After planning, the server specification is compiled into a VegaFusion task graph. The job of the Runtime is to calculate the value of requested nodes within a task graph.
A task graph includes the values of the root nodes (those with no parents), but it does not include the values of any of the interior nodes (those with parents). Each node in the task graph is a pure function of the values of its parents. This enables the Runtime to calculate the value of any node in the Task graph from the specification, while keeping the overall task graph size small enough to be efficiently transferred between the client and the server. The Runtime uses fingerprinting and precise caching to avoid repeated calculations of the same nodes. The cache is "precise" in the sense that cached values can be shared across visualizations that share a common substructure, even if the full specifications are not identical.
## Technology
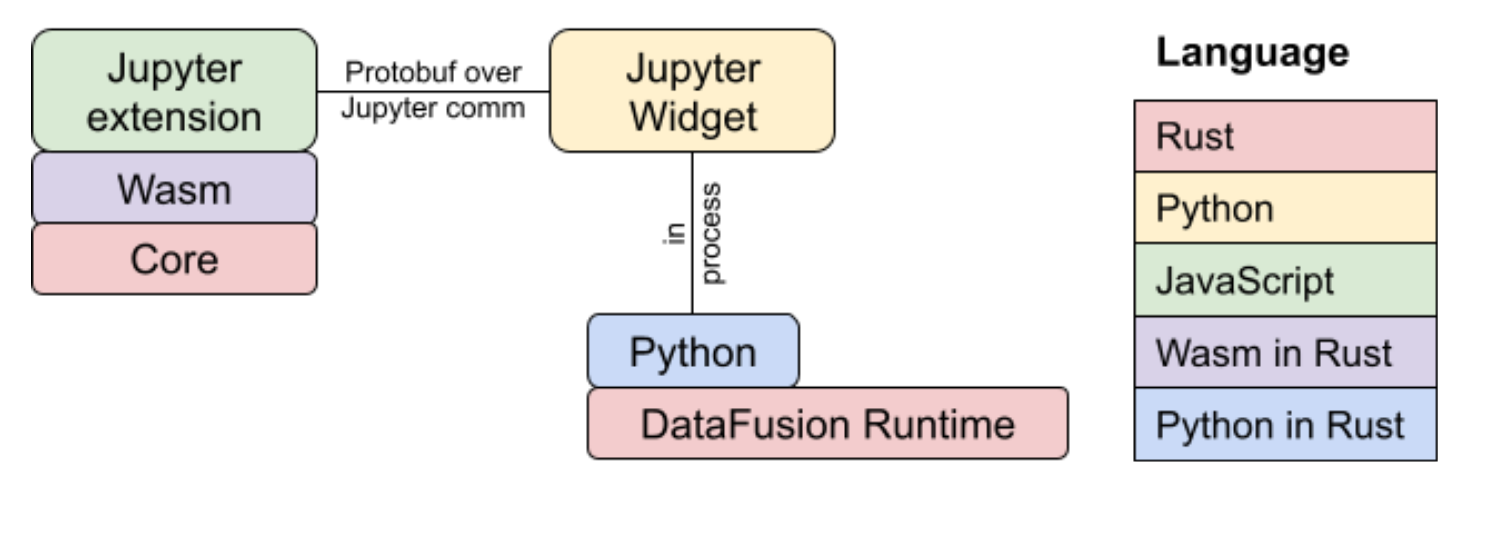
### VegaFusion Technology Stack
VegaFusion uses a fairly diverse technology stack. The Planner and Runtime are both implemented in Rust.
In the context of `vegafusion-jupyter`, the Planner is compiled to WebAssembly using [wasm-pack](https://github.com/rustwasm/wasm-pack) and wrapped in a TypeScript API using [wasm-bindgen](https://github.com/rustwasm/wasm-bindgen). This TypeScript API is used to integrate the WebAssembly library into the VegaFusion Jupyter Widget.
The Runtime is wrapped in a Python API using [PyO3](https://github.com/PyO3/pyo3), resulting in the `vegafusion-python` package. The `vegafusion-jupyter` package is used to integrate `vegafusion-python` with Altair and the Python portion of VegaFusion Jupyter Widget.
The Task Graph specifications are defined as protocol buffer messages. The [prost](https://github.com/tokio-rs/prost) library is used to generate Rust data structures from these protocol buffer messages. When Arrow tables appear as task graph root values, they are serialized inside the protocol buffer specification using the [Apache Arrow IPC format](https://arrow.apache.org/docs/format/Columnar.html#serialization-and-interprocess-communication-ipc). The binary representation of the task graph protocol buffer message is what is transferred across the Jupyter Comms protocol.
### DataFusion integration
[Apache Arrow DataFusion](https://github.com/apache/arrow-datafusion) is an SQL compatible query engine that integrates with the Rust implementation of Apache Arrow. VegaFusion uses DataFusion to implement many of the Vega transforms, and it compiles the Vega expression language directly into the DataFusion expression language. In addition to being really fast, a particularly powerful characteristic of DataFusion is that it provides many interfaces that can be extended with custom Rust logic. For example, VegaFusion defines many custom UDFs that are designed to implement the precise semantics of the Vega expression language and the Vega expression functions.
## Examples
VegaFusion is compatible with all of the examples in the [Altair gallery](https://altair-viz.github.io/gallery/index.html). Here are a few additional examples that demonstrate the benefits of server-side acceleration.
### Large Altair Gallery Examples
The following examples are modifications of Altair Gallery examples that use larger datasets. Each example displays the same plot with plain Altair and with Altair + VegaFusion to make is easy to compare performance. You can try them out using the binder links below.
#### Interactive Crossfilter
- [Notebook file](https://github.com/vegafusion/demos/blob/main/notebooks/large_altair_examples/flights_crossfilter.ipynb)
- [](https://mybinder.org/v2/gh/vegafusion/demos/HEAD?urlpath=voila%2Frender%2Fnotebooks%2Flarge_altair_examples%2Fflights_crossfilter.ipynb) - Voila Dashboard
- [](https://gesis.mybinder.org/binder/v2/gh/vegafusion/demos/93a9a68100de0d6282b114f8cf01cbb30c672267?urlpath=lab%2Ftree%2Fnotebooks%2Flarge_altair_examples%2Fflights_crossfilter.ipynb) - Jupyterlab
#### Interactive Average
- [Notebook file](https://github.com/vegafusion/demos/blob/main/notebooks/large_altair_examples/interactive_average.ipynb)
- [](https://mybinder.org/v2/gh/vegafusion/demos/HEAD?urlpath=voila%2Frender%2Fnotebooks%2Flarge_altair_examples%2Finteractive_average.ipynb) - Voila Dashboard
- [](https://gesis.mybinder.org/binder/v2/gh/vegafusion/demos/93a9a68100de0d6282b114f8cf01cbb30c672267?urlpath=lab%2Ftree%2Fnotebooks%2Flarge_altair_examples%2Finteractive_average.ipynb) - JupyterLab
### 10 Million Taxi Rides
This example creates a dashboard to explore 10 million taxi rides in New York City from January 2015. It supports zoom-based rasterization of the pickup locations (similar to [Datashader](https://datashader.org/)), and combines that with cross filtering across a histogram of trip distances and a heatmap of tip rate by hour and day of the week.
See the [PyViz documentation example](https://examples.pyviz.org/nyc_taxi/nyc_taxi.html) for more information on the dataset.
- [Notebook file](https://github.com/vegafusion/demos/blob/main/notebooks/nyc_taxi/nyc_taxi.ipynb)
## About the Name
There are two meanings behind the name "VegaFusion"
- It's a reference to the [Apache Arrow DataFusion](https://github.com/apache/arrow-datafusion) library described above
- Vega and Altair are named after stars, and stars are powered by nuclear fusion
## Licensing and Funding
At least until a sustainable funding model is established, VegaFusion will be developed under the [AGPLv3 license](https://www.gnu.org/licenses/agpl-3.0.en.html). This is a copy-left license in the GPL family of licenses. As with all [OSI approved licenses](https://opensource.org/licenses/alphabetical), there are no restrictions on what code licensed under the AGPL can be used for. However, the requirements for what must be shared publicly are greater than for licenses that are more commonly used in the Python ecosystem like [Apache-2](https://opensource.org/licenses/Apache-2.0), [MIT](https://opensource.org/licenses/MIT), and [BSD-3](https://opensource.org/licenses/BSD-3-Clause).
## Roadmap
This is only the beginning for VegaFusion. There are a lot of possible future directions, and many of them are detailed in the roadmap.
## Learn more
Here are some ways that you can get in touch to learn more.
- Check out the code on [GitHub](https://github.com/hex-inc/vegafusion/)
- Start a discussion on [GitHub Discussions](https://github.com/hex-inc/vegafusion/discussions)
- And of course, if something doesn't work please [open an issue](https://github.com/hex-inc/vegafusion/issues)
Thanks!
 ### DataFusion integration
[Apache Arrow DataFusion](https://github.com/apache/arrow-datafusion) is an SQL compatible query engine that integrates with the Rust implementation of Apache Arrow. VegaFusion uses DataFusion to implement many of the Vega transforms, and it compiles the Vega expression language directly into the DataFusion expression language. In addition to being really fast, a particularly powerful characteristic of DataFusion is that it provides many interfaces that can be extended with custom Rust logic. For example, VegaFusion defines many custom UDFs that are designed to implement the precise semantics of the Vega expression language and the Vega expression functions.
### DataFusion integration
[Apache Arrow DataFusion](https://github.com/apache/arrow-datafusion) is an SQL compatible query engine that integrates with the Rust implementation of Apache Arrow. VegaFusion uses DataFusion to implement many of the Vega transforms, and it compiles the Vega expression language directly into the DataFusion expression language. In addition to being really fast, a particularly powerful characteristic of DataFusion is that it provides many interfaces that can be extended with custom Rust logic. For example, VegaFusion defines many custom UDFs that are designed to implement the precise semantics of the Vega expression language and the Vega expression functions.