
VegaFusion 1.0#
Mime renderer, transform evaluation, and a permissive license
By: Jon Mease
The VegaFusion team is happy to announce the release of VegaFusion version 1.0. This release is the culmination of several months of work on both VegaFusion itself and its new dependency: VlConvert. This version introduces a brand new mimetype based renderer that is compatible with many notebook and compute environments without requiring custom extensions. It also includes a new transformed_data() function that makes it possible to evaluate the data transforms associated with an Altair Chart and return the result as a pandas DataFrame.
Finally, we’re thrilled to announce that VegaFusion has been adopted by Hex and is now licensed under the same permissive BSD-3 license used by Vega, Vega-Lite, and Altair.
Background#
VegaFusion scales Vega, Vega-Lite, and Altair visualizations by moving data transformations from the browser to a server (e.g. a Python kernel).
The initial focus was on supporting complex interactive visualizations that require a live two-way connection between the client and server. This approach works well, but it relies on a custom Jupyter widget extension which adds complexity and limits the environments it can be deployed in.
To reduce complexity while addressing the more common scenario of non-interactive charts, VegaFusion 1.0 introduces an entirely new renderer that does not require any custom extensions but instead leverages the built-in rendering capabilities of modern notebooks and compute environments.
VegaFusion mime renderer#
Altair comes with a default limit of 5,000 input rows to avoid crashing the user’s browser. Because all data transformations are applied in the browser by the Vega JavaScript library, the full input dataset must be loaded into the browser. The VegaFusion mime renderer performs most common Vega transforms in the Python kernel, and so the row limit is applied to the transformed data rather than the input data. When the chart includes any form of aggregation, the transformed dataset typically has many fewer rows than the input dataset.
To use the VegaFusion mime renderer, first install the vegafusion Python package with the embed extras enabled:
pip install -U "vegafusion[embed]"
Then open a Jupyter notebook (either the classic notebook or a notebook inside JupyterLab), and create an Altair histogram of a 1 million row flights dataset
import pandas as pd
import altair as alt

flights = pd.read_parquet(
    "https://vegafusion-datasets.s3.amazonaws.com/vega/flights_1m.parquet"
)

delay_hist = alt.Chart(flights).mark_bar().encode(
    alt.X("delay", bin=alt.Bin(maxbins=30)),
    alt.Y("count()")
)
delay_hist
---------------------------------------------------------------------------
MaxRowsError                              Traceback (most recent call last)
...
MaxRowsError: The number of rows in your dataset is greater than the maximum allowed (5000). For information on how to plot larger datasets in Altair, see the documentation
As expected, this results in an Altair MaxRowsError. The VegaFusion mime renderer can be used to overcome this limitation by performing data intensive transforms (e.g. filtering, binning, aggregation, etc.) in the Python kernel before the resulting data is sent to the web browser.
Run these two lines to import and enable the new VegaFusion mime renderer:
import vegafusion as vf
vf.enable()
Now the chart displays quickly without errors:
delay_hist

Transform evaluation#
VegaFusion now supports extracting the transformed data for an Altair Chart using the vegafusion.transformed_data() function. This is particularly useful when building a chart that includes a pipeline of transforms, as it’s now possible to see the intermediate results of each transform step.
Example: Top K#
Here is an example, based on the Top-K plot with Others example from the Altair documentation, of how transformed_data() can be helpful when building a complex chart.
First, create an Altair Chart wrapping the data source URL.
import altair as alt
import vegafusion as vf

source = "https://cdn.jsdelivr.net/npm/vega-datasets@v1.29.0/data/movies.json"
chart = alt.Chart(source)
The transformed_data() function can be used on this empty chart to access a preview of the data that is available at the URL. Here the row_limit argument is used to limit the result to 3 rows and the DataFrame is transposed to make it easier to read.
vf.transformed_data(chart, row_limit=3).T
0 |
1 |
2 |
|
|---|---|---|---|
Title |
The Land Girls |
First Love, Last Rites |
I Married a Strange Person |
US_Gross |
146083 |
10876 |
203134 |
Worldwide_Gross |
146083 |
10876 |
203134 |
Production_Budget |
8000000 |
300000 |
250000 |
Release_Date |
Jun 12 1998 |
Aug 07 1998 |
Aug 28 1998 |
MPAA_Rating |
R |
R |
|
Distributor |
Gramercy |
Strand |
Lionsgate |
IMDB_Rating |
6.1 |
6.9 |
6.8 |
IMDB_Votes |
1071.0 |
207.0 |
865.0 |
Major_Genre |
Drama |
Comedy |
|
Rotten_Tomatoes_Rating |
nan |
nan |
nan |
Source |
|||
Creative_Type |
|||
Director |
|||
US_DVD_Sales |
nan |
nan |
nan |
Running_Time_min |
nan |
nan |
nan |
The first step of making this chart is to compute the average worldwide gross of all the movies for each director. This can be accomplished with the Altair Aggregate Transform.
chart = (
    alt.Chart(source)
    .transform_aggregate(
        aggregate_gross='mean(Worldwide_Gross)',
        groupby=["Director"],
    )
)
vf.transformed_data(chart, row_limit=5)
Director |
aggregate_gross |
|
|---|---|---|
0 |
3.59284e+07 |
|
1 |
Christopher Nolan |
3.44251e+08 |
2 |
Roman Polanski |
5.13407e+07 |
3 |
Richard Fleischer |
2.27635e+07 |
4 |
Blake Edwards |
5e+06 |
Next, the directors are ranked by average gross in descending order. This can be accomplished with the Altair Window Transform
chart = (
    alt.Chart(source)
    .transform_aggregate(
        aggregate_gross='mean(Worldwide_Gross)',
        groupby=["Director"],
    ).transform_window(
        rank='row_number()',
        sort=[alt.SortField("aggregate_gross", order="descending")],
    )
)
vf.transformed_data(chart, row_limit=5)
Director |
aggregate_gross |
rank |
|
|---|---|---|---|
0 |
David Yates |
9.37984e+08 |
1 |
1 |
James Cameron |
8.29781e+08 |
2 |
2 |
Carlos Saldanha |
7.69293e+08 |
3 |
3 |
Pete Docter |
7.31305e+08 |
4 |
4 |
Andrew Stanton |
7.00319e+08 |
5 |
Then, a new column is added that contains the director’s name for the top 9 ranked directors and “All Others” for the remaining directors. This can be accomplished using the Altair Calculate Transform.
chart = (
    alt.Chart(source)
    .transform_aggregate(
        aggregate_gross='mean(Worldwide_Gross)',
        groupby=["Director"],
    ).transform_window(
        rank='row_number()',
        sort=[alt.SortField("aggregate_gross", order="descending")],
    ).transform_calculate(
        ranked_director="datum.rank < 10 ? datum.Director : 'All Others'"
    )
)
vf.transformed_data(chart, row_limit=12)
Director |
aggregate_gross |
rank |
ranked_director |
|
|---|---|---|---|---|
0 |
David Yates |
9.37984e+08 |
1 |
David Yates |
1 |
James Cameron |
8.29781e+08 |
2 |
James Cameron |
2 |
Carlos Saldanha |
7.69293e+08 |
3 |
Carlos Saldanha |
3 |
Pete Docter |
7.31305e+08 |
4 |
Pete Docter |
4 |
Andrew Stanton |
7.00319e+08 |
5 |
Andrew Stanton |
5 |
David Slade |
6.88155e+08 |
6 |
David Slade |
6 |
George Lucas |
6.73577e+08 |
7 |
George Lucas |
7 |
Andrew Adamson |
6.43134e+08 |
8 |
Andrew Adamson |
8 |
Peter Jackson |
5.95566e+08 |
9 |
Peter Jackson |
9 |
Richard Marquand |
5.727e+08 |
10 |
All Others |
10 |
Eric Darnell |
5.66099e+08 |
11 |
All Others |
11 |
Roland Emmerich |
4.5506e+08 |
12 |
All Others |
Finally, this dataset is ready to be encoded as a bar mark:
import altair as alt
import vegafusion as vf

vf.enable()

source = "https://cdn.jsdelivr.net/npm/vega-datasets@v1.29.0/data/movies.json"
chart = (
    alt.Chart(source)
    .transform_aggregate(
        aggregate_gross='mean(Worldwide_Gross)',
        groupby=["Director"],
    ).transform_window(
        rank='row_number()',
        sort=[alt.SortField("aggregate_gross", order="descending")],
    ).transform_calculate(
        ranked_director="datum.rank < 10 ? datum.Director : 'All Others'"
    ).mark_bar().encode(
        x=alt.X("aggregate_gross:Q", aggregate="mean", title=None),
        y=alt.Y(
            "ranked_director:N",
            sort=alt.Sort(op="mean", field="aggregate_gross", order="descending"),
            title=None,
        ),
    )
)
chart
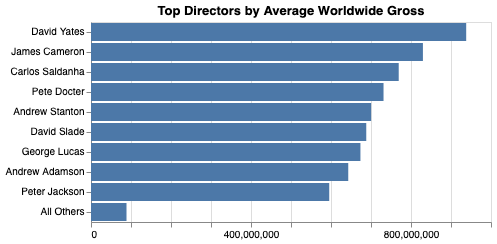
The exact value of each bar can be accessed by applying transformed_data() to the final chart (which includes the implicit transforms in the bar mark encoding).
vf.transformed_data(chart)
ranked_director |
mean_aggregate_gross |
|
|---|---|---|
0 |
David Yates |
9.37984e+08 |
1 |
James Cameron |
8.29781e+08 |
2 |
Carlos Saldanha |
7.69293e+08 |
3 |
Pete Docter |
7.31305e+08 |
4 |
Andrew Stanton |
7.00319e+08 |
5 |
David Slade |
6.88155e+08 |
6 |
George Lucas |
6.73577e+08 |
7 |
Andrew Adamson |
6.43134e+08 |
8 |
Peter Jackson |
5.95566e+08 |
9 |
All Others |
8.87602e+07 |
Increased transform coverage#
VegaFusion’s coverage of Vega-Lite’s transforms is not yet complete, but it’s growing with each release. Support for the Pivot, Impute, Fold, and Sequence transforms was added in this release. Here is the full set of supported Vega-Lite/Vega transforms:
More on the way!
Leveraging VlConvert#
Both the new mime renderer and the transfomed_data() function require the ability to convert Vega-Lite specifications (as produced by Altair) to Vega specifications (as consumed by VegaFusion). This functionality is provided by the Vega-Lite JavaScript library, which presents a challenge: How can we perform this conversion in Python without a web browser?
To meet this challenge, we developed a new Python library called VlConvert. You can read all about VlConvert in its announcement post, but in short it embeds the Deno JavaScript runtime in a Python library for the purpose of running the Vega-Lite JavaScript library.
While motivated by the needs of VegaFusion, VlConvert turned out to be a great foundation for implementing static image export, as it is a simple Python package that doesn’t require external dependencies on a web browser or Node.js. In fact, VlConvert has been adopted by the Vega community and will be the default image export engine for the coming release of Altair 5!
A new partnership and a new license#
VegaFusion was first released in January 2022 under the copyleft AGPL license. I chose to use the AGPL license initially because I wanted to share the work with the Vega community, but I also wanted to leave open the possibility of building a company with a dual-license business model around the project.
The day of the initial release, Barry McCardel (the CEO of Hex Technologies) reached out to me, and we started talking about how VegaFusion could help scale the Hex chart cell (which is itself built on Vega-Lite). I granted them a commercial license exception, and started working with the Hex team to integrate VegaFusion into Hex. After months of working together with Barry and the Hex team, and lots of conversations around the future of the project, we decided that the best path forward was for me to continue working on VegaFusion as a member of Hex team, and for VegaFusion to be re-licensed to a permissive license that is compatible with the rest of the Vega ecosystem.
The end result is that VegaFusion 1.0 is licensed under the BSD-3 license. Also, to make it easier to take advantage of Hex’s testing infrastructure the VegaFusion repositories have been moved under the hex-inc GitHub organization.
Learn more#
Check out these resources if you’d like to learn more: